
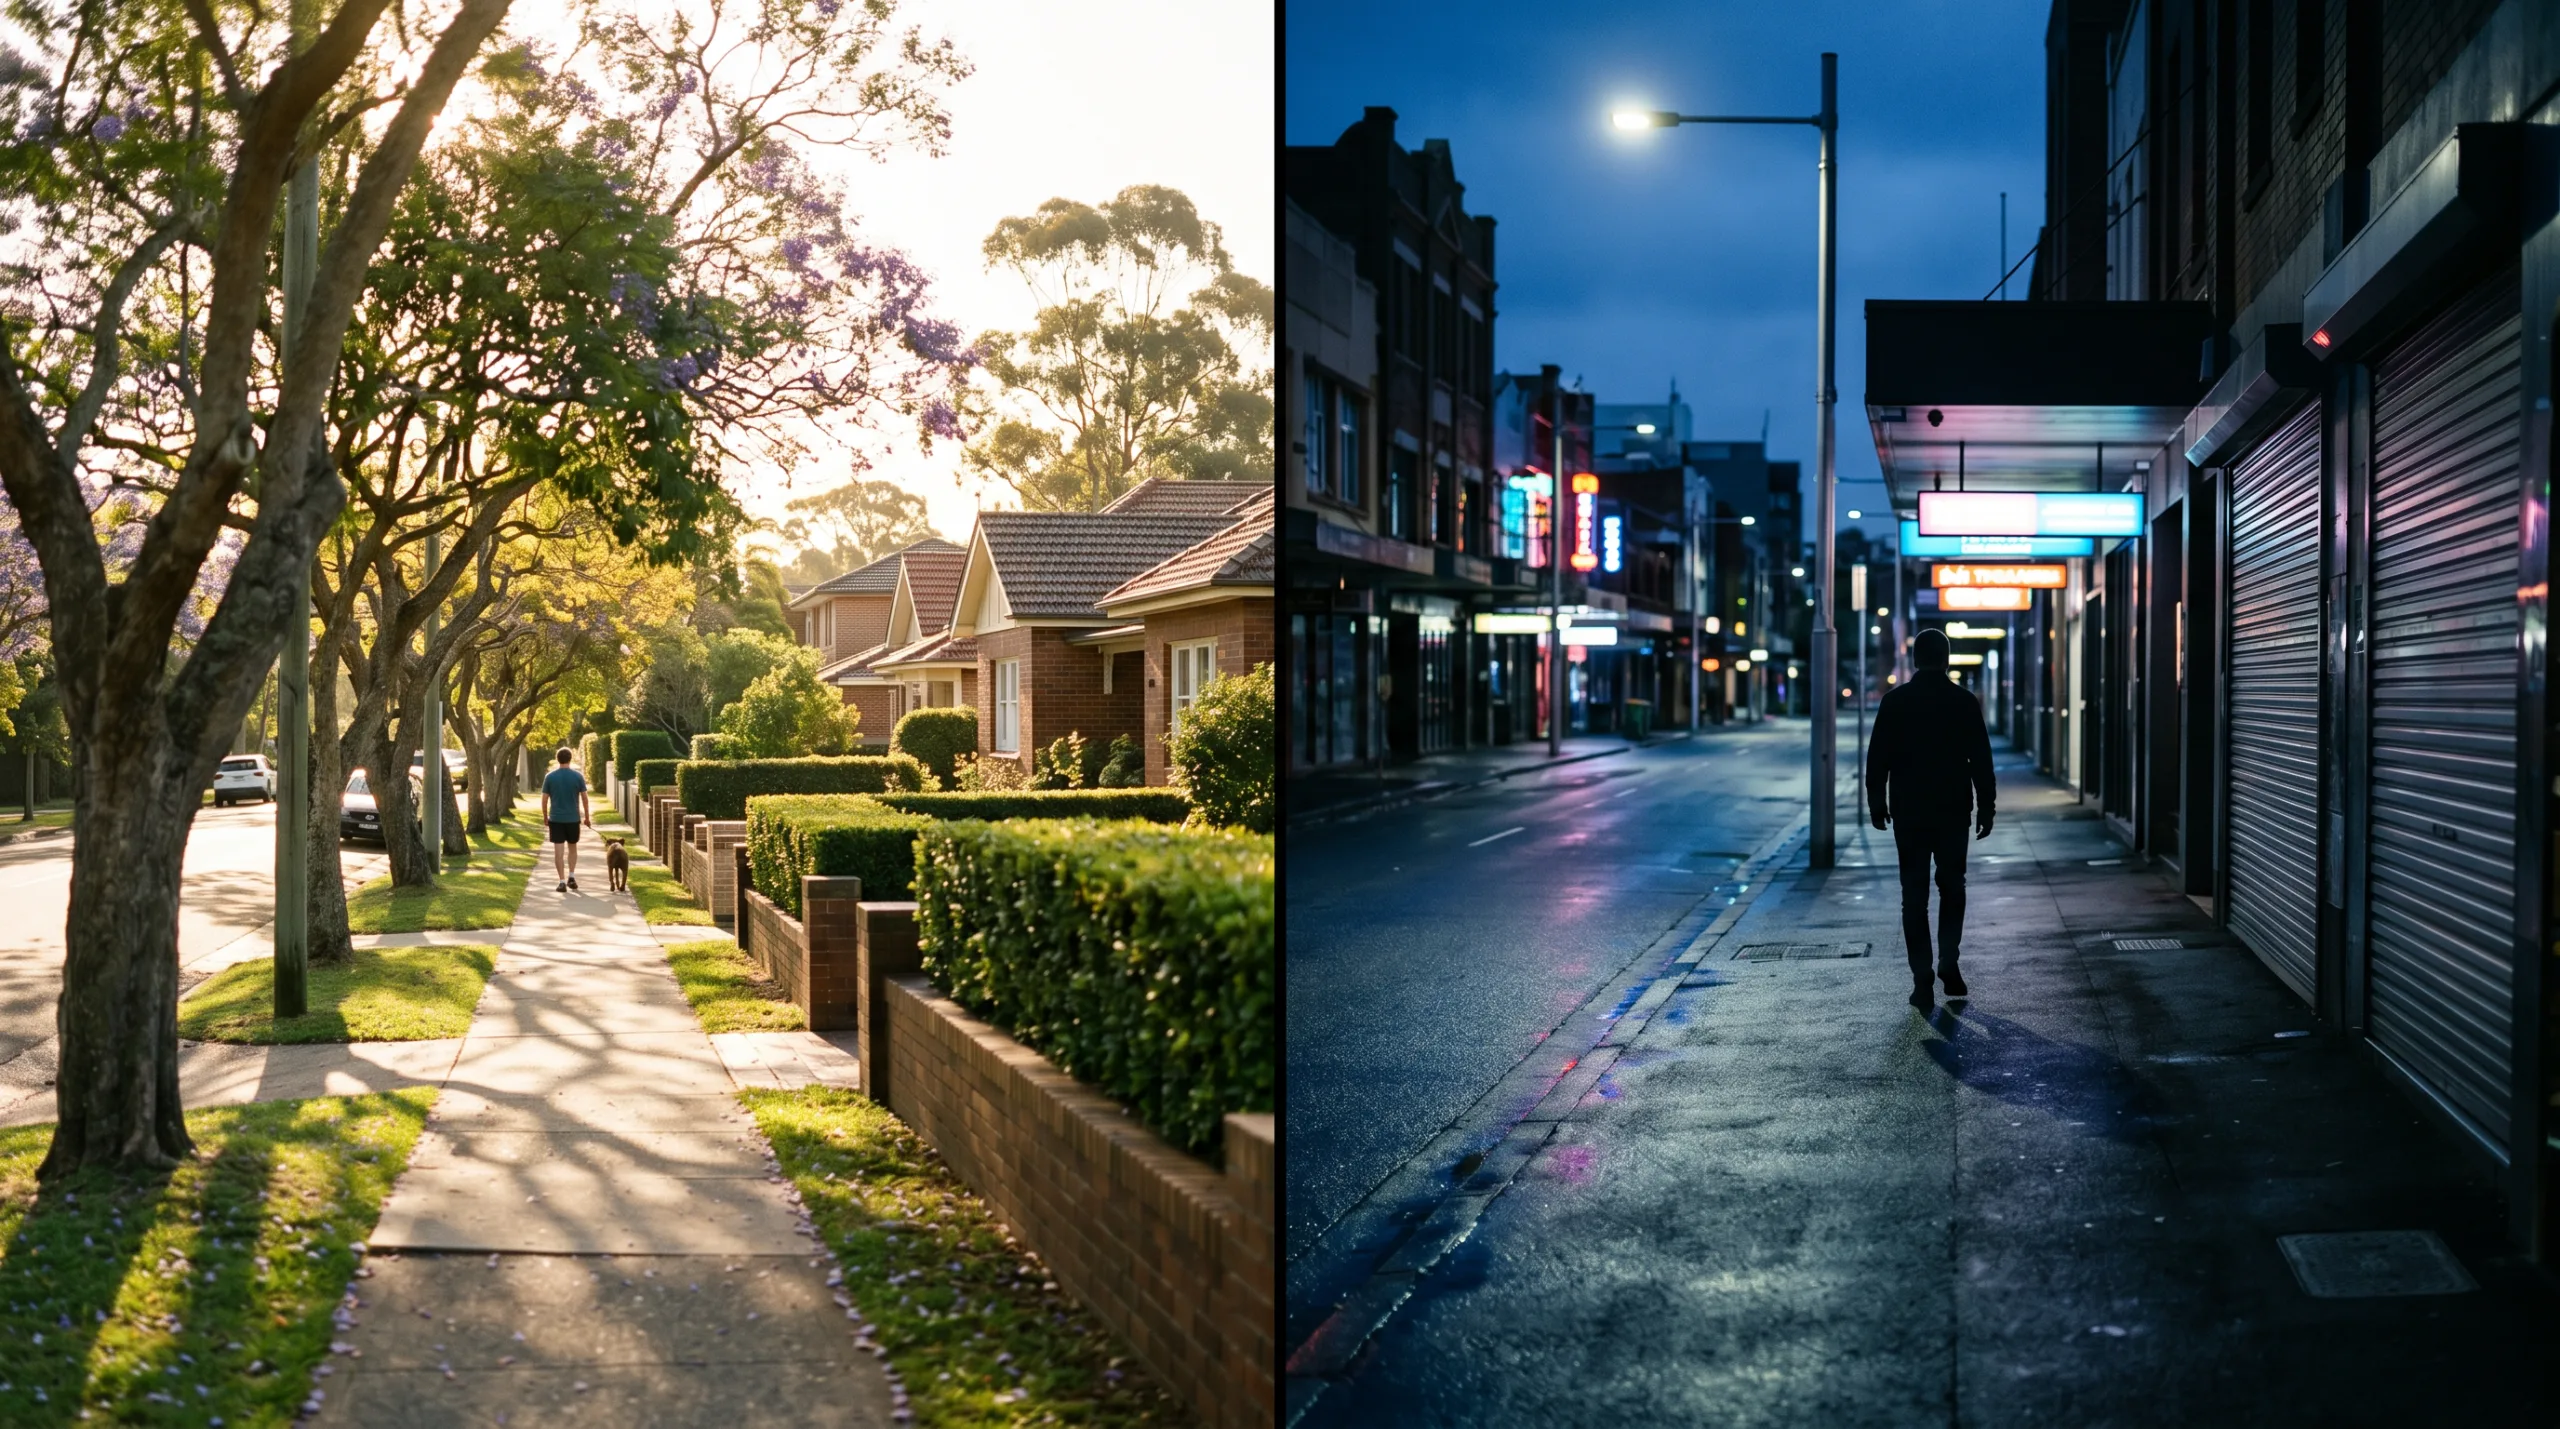
Here is a number that will surprise almost everyone who lives in Sydney. Over the year to March 2026, the beachside eastern-suburbs area around Bondi recorded a higher rate of non-domestic assault per resident than Canterbury-Bankstown in the city’s south-west.
You read that right. Not a higher total, a higher rate, meaning more recorded incidents for every 100,000 people who live there. That single fact upends most of what Sydneysiders assume about which parts of their city are “safe” and which aren’t.
We went to the only source that actually counts: the NSW Bureau of Crime Statistics and Research (BOCSAR), the government body that records every offence reported to police, area by area. We pulled the recorded rate of non-domestic-violence assault for ten Sydney local government areas for the 12 months to March 2026, and the reasons behind those results matter more than the ranking.
The One Chart That Reframes Sydney’s Crime Map
Rank Sydney’s areas by rate rather than by raw count, and a familiar story falls apart. The rate is what matters: it measures incidents against how many people actually live somewhere, so it doesn’t simply reward the biggest suburbs for being big.
Here is what BOCSAR recorded, per 100,000 residents, over the year to March 2026.
The gap between the top and the bottom is real. Blacktown’s rate is more than four times Ku-ring-gai’s. But the middle of the table is where the assumptions break. Waverley, which takes in Bondi and Bronte, sits above Canterbury-Bankstown, Randwick and the Inner West. Woollahra, one of the most expensive postcodes in the country, records a rate barely different from Hunters Hill.
Rank by rate, not headlines, and “safe suburb” starts to look like a story we tell ourselves rather than a fact the data supports.
None of this makes Bondi a place to avoid. It means a per-resident rate is shaped by far more than how wealthy or “rough” an area feels, as the next section shows.
Why The Beach Tops The West (and it isn’t what you think)
An assault statistic doesn’t measure only the people who live in an area. It measures every incident police record inside that area, including incidents involving people who were only ever there for a night.
Waverley is a case study in this. Bondi Beach draws enormous weekend and summer crowds, and it has a dense strip of late-night venues. A late-night assault outside a Bondi pub is recorded against Waverley’s count, but the people involved often live somewhere else entirely. The rate is then calculated against Waverley’s resident population, a relatively small denominator, which pushes the per-capita figure up.
BOCSAR flags exactly this effect in its own notes. Rate calculations, it warns, “should be treated very cautiously for LGAs that have high visitor numbers relative to their residential population,” because “no adjustment has been made for the number of people visiting each LGA per year.”
In plain terms: a nightlife and tourism area can post a high assault rate that says very little about how safe it is to live there. The same effect flatters quieter, purely residential areas in the opposite direction.
The Number BOCSAR Refuses To Rank
If you want the single clearest proof that raw rankings mislead, look at the City of Sydney.
Over the same year, the City of Sydney LGA recorded a non-domestic assault rate of roughly 1,231 per 100,000, more than three times the state average and off the top of the chart above. On a naive “most dangerous” list, it would win in a landslide.
BOCSAR won’t rank it at all.
“Sydney LGA is excluded from the rankings because the resident population does not reflect the number of people present each day.” (BOCSAR)
The reason is the denominator problem in its most extreme form. Hundreds of thousands of workers, commuters, students and visitors pour into the CBD every day and go home at night. Divide the incidents recorded there by only the people who sleep there, and you get a rate that describes a transient daytime and nightlife population, not the residents. The government’s own statisticians treat that number as too misleading to rank. That is a useful warning about every headline that ranks it anyway.
What The Data Can And Can’t Tell You
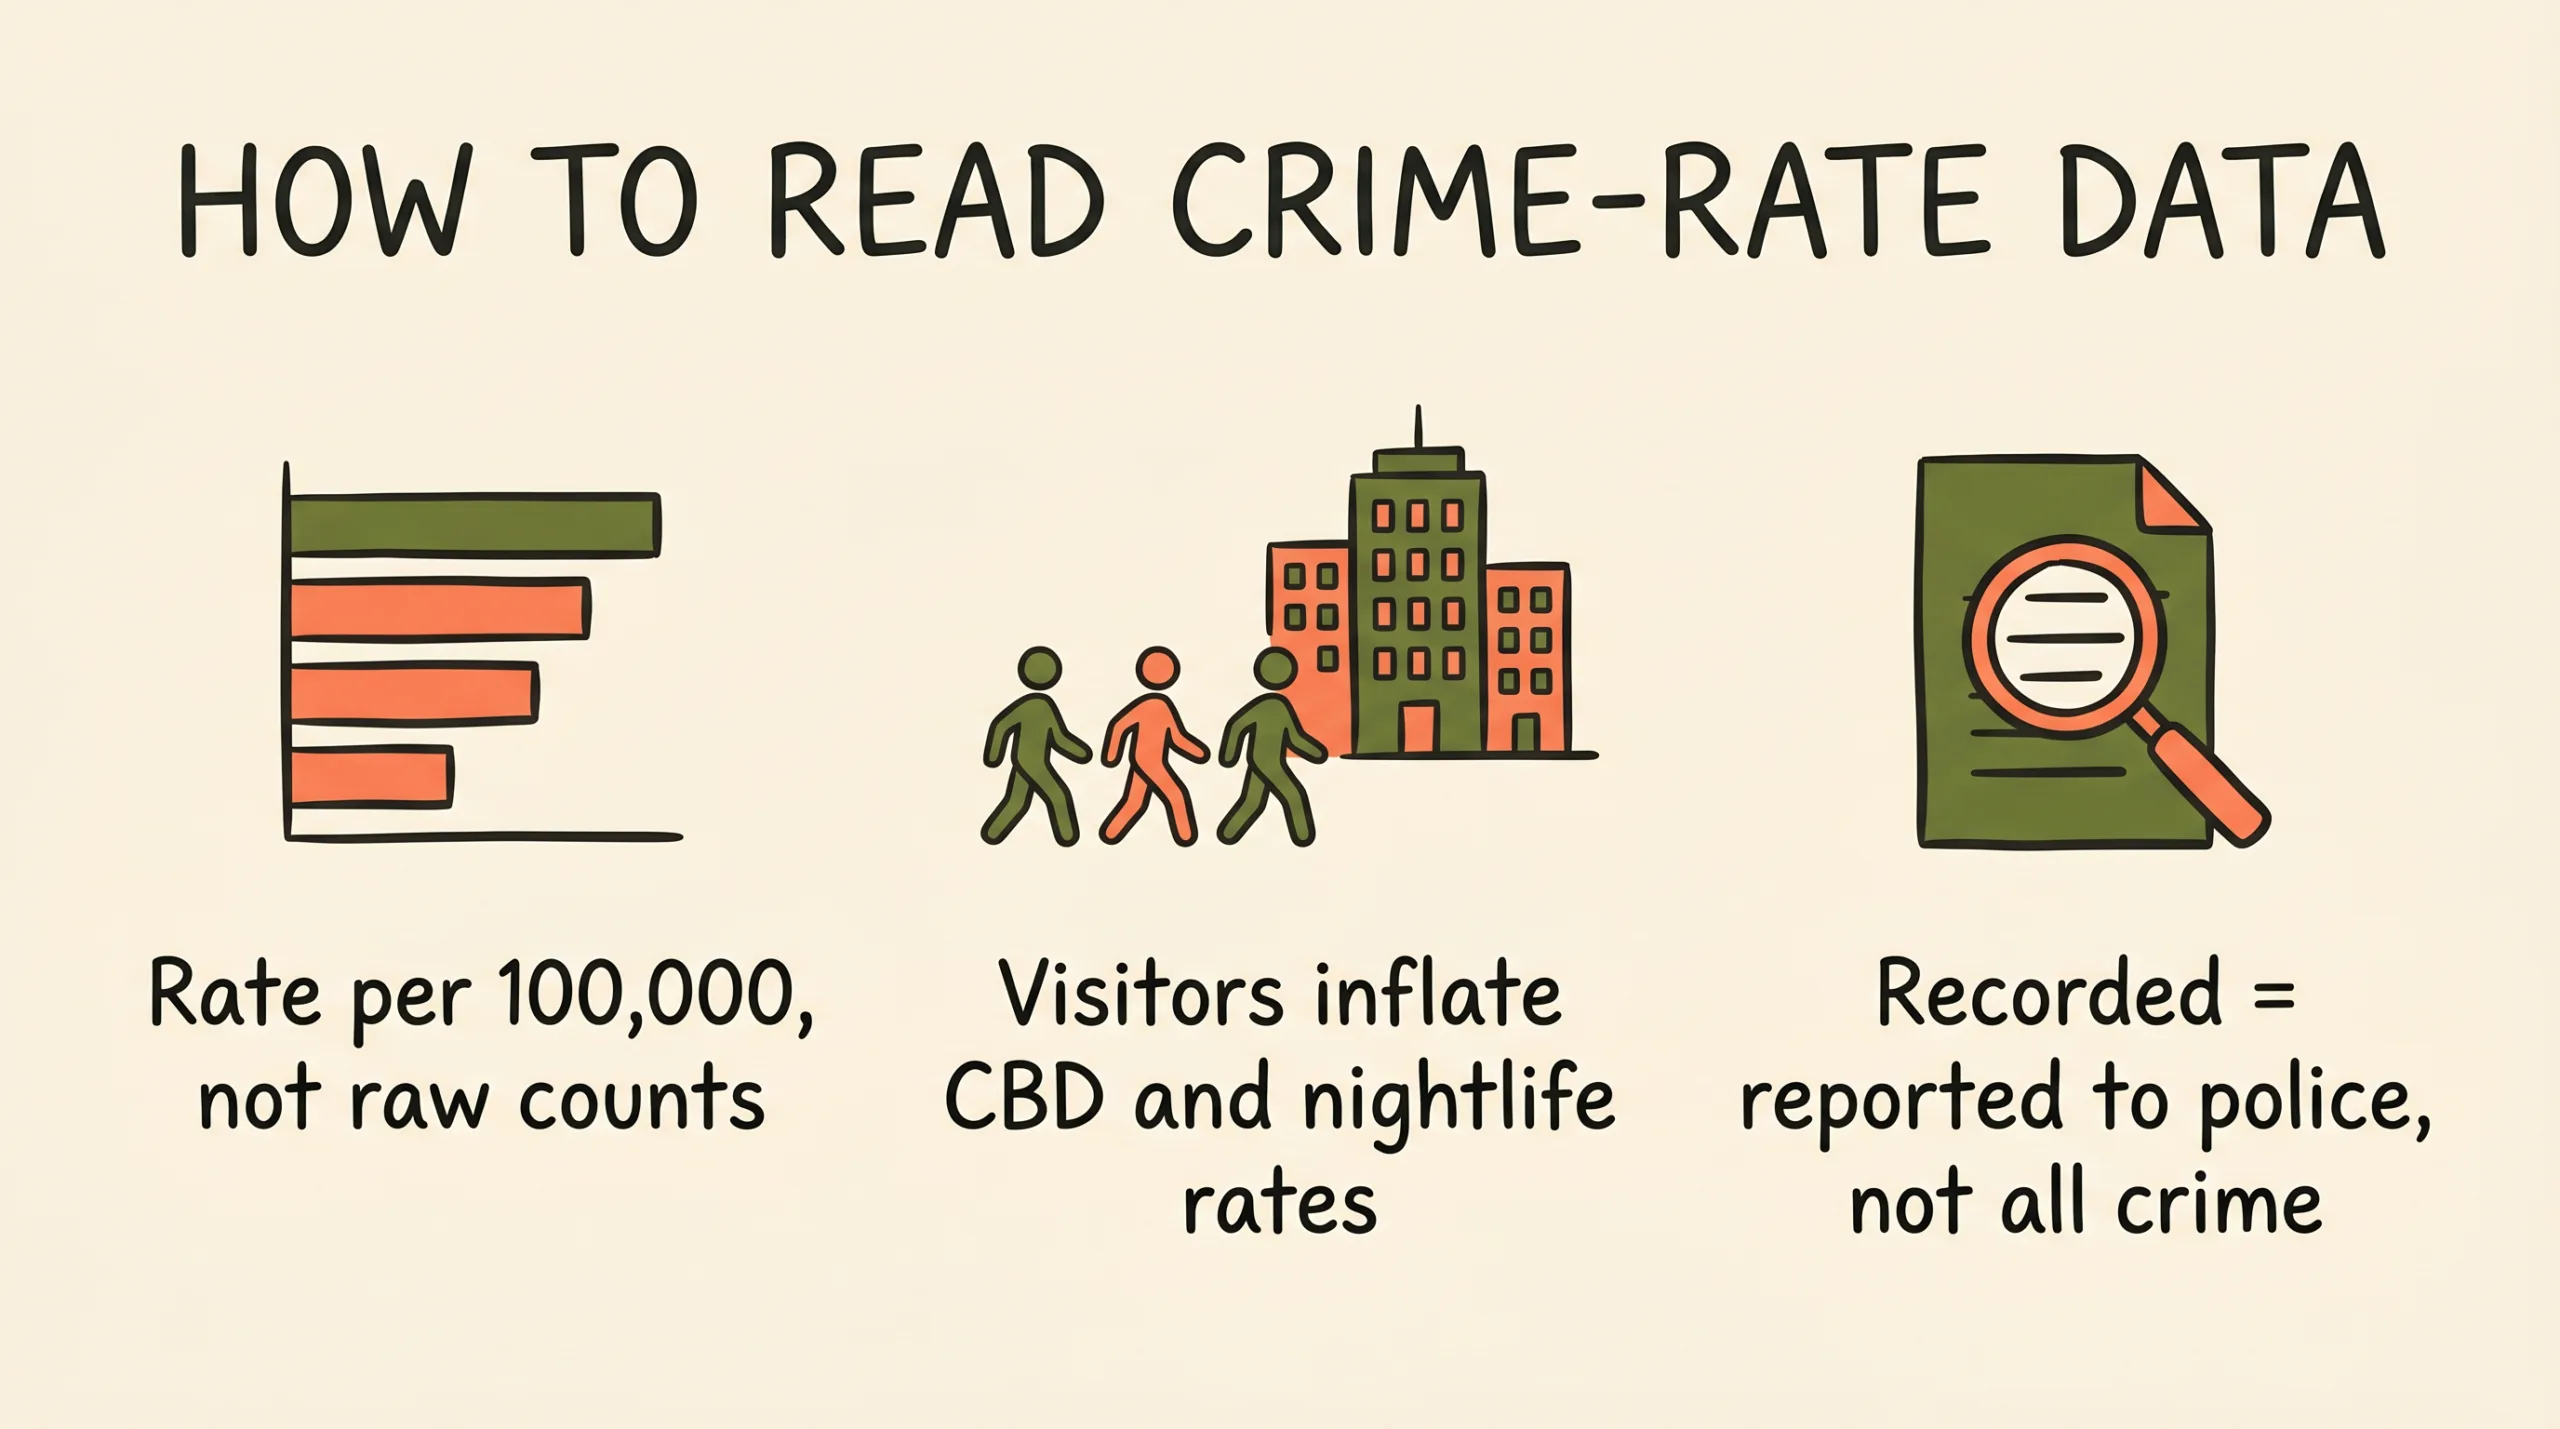
A recorded-crime rate is a genuinely useful figure, but only if you read it for what it is. Four caveats travel with every number in this piece.
- Recorded, not actual. BOCSAR counts what’s reported to and recorded by police, not every offence that occurs. Areas with more active policing, more CCTV, or higher community trust in police can show higher recorded rates for the same underlying behaviour.
- The denominator matters. Rates are calculated against resident population using data prepared by the Australian Bureau of Statistics. Where a lot of non-residents pass through, such as CBDs, entertainment precincts and transport hubs, the rate overstates the risk to people who actually live there.
- Small numbers are jumpy. BOCSAR cautions that where incident counts are low, “large percentage change in rates … will result from small changes in incident counts.” A quiet area’s rate can swing sharply on a handful of extra incidents.
- This is one category only. These figures are non-domestic assault. Domestic-violence assault, break-and-enter, theft and fraud are counted separately and tell different stories. A single blended “crime rate” hides more than it reveals.
Please note that because Waverley takes in Bondi Junction as well as Bondi Beach, these figures record non-domestic assault, and they cover the year to March 2026. They do not include, and are in no way a measure of, the April 2024 attack at Westfield Bondi Junction. That was a separate and far graver event, recorded under different and more serious categories entirely. We mention it only so that nothing on this page is misread as connected to that tragedy.
Put together, these mean the chart is a fair report of official statistics. It is not a safety score, and certainly not a verdict on the people who live anywhere on it.
What This Means For You
If you live in one of these areas, the honest takeaway is reassuring. A high recorded rate in a nightlife or CBD-adjacent area is largely driven by people who don’t live there and by the intensity of policing, not by your street. Your own risk is far more about specific circumstances than about a suburb-wide average.
If you’ve been assaulted, the data carries a different message: you are not an outlier. Non-domestic assault is one of the more commonly recorded offences across every part of Sydney, affluent and otherwise. Being a victim of violence can open the door to a victims-of-crime support and compensation claim, and you don’t have to weigh that up alone.
And if you’re facing an assault charge arising from an incident somewhere on this list, whether a fight outside a venue or a scuffle that escalated, the suburb it happened in is context, never a conclusion. What a court looks at is the specific evidence: what actually happened, whether the elements of the offence are made out, and whether a defence such as self-defence applies. A high local rate proves nothing about your case.
How O’Brien Criminal & Civil Solicitors Can Help
Crime data speaks to both sides of an incident, and so do we.
If you’ve been affected by an assault or another offence, our team can help you understand whether you have a victims-of-crime support and compensation claim, and guide you through a process that’s built to be difficult to face on your own.
If you’re facing an assault or other criminal charge, our defence team can help. We will look at the actual evidence in your matter and work to achieve the best possible outcome, whatever suburb it arose in.
For a broader look at how recorded crime varies across the city, see our companion piece on Sydney suburbs with the highest and lowest crime rates. If your matter involves police conduct rather than a charge, our guide to police misconduct complaints and compensation in NSW explains your options.
Request initial advice (no-obligation) via the form below or call us on (02) 9261 4281.

Peter O'Brien is the Principal Solicitor of O'Brien Criminal & Civil Solicitors and Australia's leading expert in intentional torts litigation, with over 25 years of experience securing landmark victories in malicious prosecution and unlawful imprisonment cases. Author of Intentional Tort Litigation in Australia and recipient of the Law Council of Australia President's Medal, Peter has achieved record-breaking compensation for clients and is widely recognised for his unwavering commitment to access to justice.